Journal of Animal Research: v.10 n.1, p. 53-57. February 2020
DOI: 10.30954/2277-940X.01.2020.7
Effect of Body Condition Score (BCS) on Production Performance of Sahiwal Cattle
ABSTRACT
The present investigation was carried out with the total of 18 Sahiwal cattle of 1st to 4th parity were selected for the study and distributed into three different groups based on their pre calving BCS (before 15 days of expected date of calving) namely G1 (2.50 - 3.00), G2 (3.25 - 3.75) and G3 (4.00 and above) with six animals in each group. The average fortnight milk yield increased up to 60th day and thereafter declined up to 90th day in G1, G2 and G3 group of animals, which was significant (p<0.05) up to 75th day. G3 group animals had highest average fortnightly cumulative Milk yield (Kg) in entire study period. Highest 305 days predicted lactation milk yield (2462.66 Kg /lactation) and average peak yield (16.50 Kg/ animal) was obtained in G3 group animals and the lowest predicted lactation milk yield (1870.68 Kg/lactation). The 305 days predicted lactation milk yield in G2 group animals was 2356.75 Kg /lactation and average peak yield was 14.90 Kg/ animal. The G3 group animals also attained their peak yield in 46 days compared to G2 and G1 group animals with 51 and 54 days, respectively. The persistency of milk production was highest in G2 group animals with 65.63 % followed by G3 and G1 group animals. The studied revealed that BCS had a significant (P<0.05) effect on post-partum estrus and service period in experimental animals.
Keywords: Sahiwal, Body Condition Score, Estrus, Persistency, Fortnight
Milk is the primary product of livestock sector and has placed India on the 1st position in global ranking. The cattle herds include a variety of purebred animals such as Sahiwal, Red Sindhi, Tharparker, Kankrej, Gir and majority of crossbred. India is the native tract for the best milk producing cattle. Cattle play a very significant role ineconomy of the country especially for small and marginal farmers.
The dairy animals use their body reserves as an energy source in early lactation to support high milk yield that is why adequate amount of nutrients must be stored in body tissues during late lactation. In early lactation the energy intake does not keep pace with continuously rising milk yield as a result energy deficit increases. This leads to a competitive situation among milk yield, fertility and health of the dairy cow because these traits are linked with energy requirement (Coenen and Peter, 2014).
Animal with high BCS at calving are more prone to milk fever, ketosis and downer cow syndrome (Garnsworthy and Topps, 1987; Jones, 1987). Thus, BCS has received considerable attention as a tool to aid in the management of nutritional and production programs in dairy herds.
Milk production capacity of dairy animals is also influenced by the length of service period in the same lactation. An optimum service period is necessary for providing the required rest to the animal after calving so that proper involution of uterus and energy regain takes place for subsequent lactation. A long service period would lead to higher calving interval, thereby, increase in dry period. However, both shorter and longer service period causes loss of production. So, to maximize the milk production, optimum length of service period should be judged.
How to cite this article: Sharma, V., Jhirwal, A.K., Goswami, S.C., Choudhary, V.K., Singh, V. and Meena, B.P. (2020). Effect of body condition score (BCS) on production performance of Sahiwal cattle. J. Anim. Res., 10(1): 53-57.
MATERIALS AND METHODS
A total of 18 Sahiwal cattle of 1st to 4th parity were selected for the study. The study was conducted for a period of 6 month at Livestock Research Station, Kodamdesar.
Experimental design
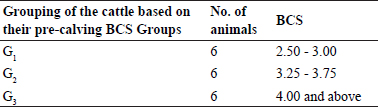
Eighteen Sahiwal cattle were distributed into three separate groups based on their pre-calving BCS (15 days before expected date of calving) namely G1, G2 and G 3with six animals in each group as shown in Table 1.
Table 1: Grouping of the cattle based on their pre-calving BCS
Production parameter
Milk yield
Daily milk yield (L) up to 12 weeks of lactation was measured every day both morning and evening.
Peak milk yield
Peak milk yield was obtained from the computed data of the farm.
Predicted Lactation yield
Predicted Lactation yield (305 days) was calculated by using ratio factor estimation.
Factor = Av.305 days milk yield / milk yield in 90 days The lactation yield upto 12 weeks will be multiplied by the corresponding ratio factor to obtain estimates of lactation yield.
Persistency of milk production
Persistency of the individual lactation curve was calculated by using the method proposed by Prasad et al. (1999). Persistency was calculated by using the formula as follows:
Persistency = (Average milk production during post peak period / Peak yield)
Fat Corrected Milk yield (FCM)
The FCM was calculated by using the formula:
4% FCM = 0.4 total milk + 15 total fat (Thomas and Sastry, 2012).
Analysis of data
The collected and tabulated data was analyzed by using IBM SPSS 20.0.
RESULTS AND DISCUSSION
Production parameter
Milk yield
Average fortnightly Milk yields (Kg) changes with different BCS groups in Sahiwal cattle are presented in table 2.
The average fortnightly milk yield increased up to 60th day and thereafter declined up to 90th day in G1, G2 and G3 group animals, respectively, which was found significant (P<0.05) up to 75th day.
The G3 group animals had highest milk yield followed by G2 and G1 group animal, although the variation in milk yield was found significant. Further from 75th to 90thday, G3 group animals had highest milk yield followed by G2 and G1 group of animal, which was found to be non-significantly high in G3, whereas, non significant differences were found between G1 and G2 group.
Table 2: Average fortnightly milk yield (Kg) with different BCS groups in Sahiwal cattle
Note: Different superscript in a column (Small letter a,b,c,d,e) differ significantly (p<0.05); Different superscript in a row (Capital letter X, Y, Z) differ significantly (p<0.05).
Table 3: Average fortnightly cumulative milk yield (Kg) in Sahiwal cattle with different BCS groups
Note: Different superscript in a column (small letter a, b, c) differ significantly (p<0.05).
Table 4: Average fortnightly daily milk yield (Kg) in Sahiwal cattle with different BCS groups
Note: Different superscript in a column (Small letter a,b,c,d,e) differ significantly (p<0.05); Different superscript in a row (Capital letter X, Y, Z) differ significantly (p<0.05)
The average cumulative milk yields at fortnight intervals in different groups of Sahiwal are presented in table 3. The 90 days average cumulative milk yield was 779.42±6.02, 982.08±5.82 and 1026.10±5.57 Kg /animal in G1, G2 and G3 groups, respectively. There was significant difference between the groups. The G3 group animals had highest average fortnight cumulative milk yield (Kg) in entire study period followed by G2 and G1 group of animals.
Similar findings were reported by Moira et al. (1978) in dairy cow, Gransworthy and Topps (1982), Roche et al. (2007), Roche et al., (2009), Musthaq (2010) in Niliravi buffalo, Bannuvalli et al. (2014) in crossbred dairy cow and Meena et al., (2019b) in Kankrej cow. However, Pryce et al. (2000) observed a higher feed intake and milk yield in thin cows at the time of calving compared to obese cows, which is in disagreement with the present study.
The average fortnight daily milk yield (Kg) in Sahiwal cattle with different BCS groups are presented in table 4.
The average fortnightly daily milk yield (Kg) increased up to 60th day and thereafter decreased gradually up to 90th day in G1, G2 and G3 group of animals. However, the significant (P<0.05) increase in fortnightly daily milk yield (Kg) was observed from 15th day to 60th day in G1, G2 and G3 group of animals. The average fortnightly daily milk yield differed significantly among the three groups.
Predicted lactation yield (305 days)
The predicted lactation yield of different BCS groups in Sahiwal cattle are presented in table 5. The result of the study indicated that highest predicted lactation milk yield was obtained in G3 group animals with 2462.66 Kg/lactation and the lowest predicted lactation milk yield was in G1 group animals with 1870.68 Kg/lactation. The predicted lactation milk yield in G2 group animals was 2356.75 Kg/lactation. There was significant difference between the predicted lactation yield of G1 with G2 and G3 groups. Similar findings were reported by Meena et al.(2019b) in Kankrej cow.
Peak milk yield and days to attain peak milk yield
The peak milk yield of different BCS group in Sahiwal cattle are presented in table 5. The highest average peak yield was recorded in G3 group animals with 16.5 Kg / animal at test day yield followed by 14.9 and 12.7 Kg/ animal at test day yield in G2 and G1 groups, respectively. The G3 group animals attained their peak yield in 46 days compared to G2 and G1 group of animals which attained the same by 51 and 54 days, respectively. Similar findings were reported by Moira et al. (1978) and Takeshi et al.(2011) and Meena et al. (2019b).
Table 5: Milk yield traits
Persistency (%)
The persistency of production in different BCS group in Sahiwal cattle are presented in table 5. The persistency of milk production was higher in G2 group animals with 65.63% than that of G1 and G3 groups of animals with 61.10% and 62.25%, respectively. Similar findings were reported by Moira et al. (1978), Takeshi et al. (2011) and Meena et al. (2019b).
Fat Corrected Milk (FCM) yield (Kg)
The average fortnightly fat corrected milk yield (FCM) in Sahiwal cattle with different BCS groups are presented in table 6. The average fortnightly FCM in all three G1, G2 and G3 group of animals increased up to 60th day and thereafter declined up to 90th day, which was found to be significant.
The average fortnightly FCM (Kg/animal) from calving to 90th day in G3 group animals had highest FCM followed by G2 and G1 groups of animal, although the variation in FCM was found significant (P<0.05). Further from 75th to 90thday, the animals of G3 group had highest FCM followed by the animals of G2 and G1 group animal, whereas G1 group animal was found to be significant (P<0.05) with G2 and G3 group of animals. The total 90th day FCM were 638.42±2.13, 742.69±3.02 and 761.74±3.12 Kg/ animal in G1, G2 and G3 groups, respectively. There was significant difference between the groups. Similar finding were reported by Prasad and Tomar (1996) and Singh et al. (2015).
Table 6: Average fortnightly Fat Corrected Milk (FCM) yield (Kg) in Sahiwal cattle with different BCS groups
Note: Different superscript in a column (Small letter a,b,c,d,e,f) differ significantly (p<0.05); Different superscript in a row (Capital letter X, Y, Z) differ significantly (p<0.05).
CONCLUSION
In present study was concluded that an early lactation the milk yield, predicted lactation yields and fat corrected milk yield were higher in high BCS group of animals but significant during study period. Animal with moderate (3.25-3.75) BCS at calving showed better performance in respect to productive traits.
Acknowledgements
The authors thankfully acknowledged the financial support and facilities provided by RAJUVAS, Bikaner to carry out the research work.
Conflict of Interest
We declare that we have no conflict of interest.
REFERENCES
Banuvalli, N., Bhaskaran, R., Krishnamurthy, U., Gurraj P.M., Kumar, H. and Ramesh, H.S. 2014. Effect of Body Condition Score at parturition on post-partum productive and reproductive performance in cross breed dairy Cows. Int. J. Livest. Res., 4 (8): 5-11.
Coenen, H. and Peter, M.S. 2014. Associations among body condition score, body weight, and milk weight in crossbred dairy cattle in a confined dairy operation. Tarleton State University.
Garnsworthy, P.C. and Topps, J.H. 1982. The effect of body condition of dairy cows at calving on their food intake and performance when given complete diets. J. Anim. Prod., 35(01): 113-119.
IBM SPSS statistics for windows, VERSION; 20.0.
Meena, B.P., Goswami, S.C., Kumar, V, Jhirwal, A.K., Singh, V. and Sharma, V. 2019b. Study the relationship of body condition scores with production performance in Kankrej cattle. J. Entomol. Zool. Stud., 7 (1): 1465-1468.
Moira, J., Frood, A. and Croxton, D. 1978.The use of condition-scoring in dairy cows and its relationship with milk yield and live weight. J. Anim. Prod., 27 (03): 285-291.
Mushtaq, A. 2010. Effect of Physiological states on milk fatty acids profile In dairy cows and buffaloes. Ph.D. Thesis, (Livestock production and management), North-West Frontier Province, Agricultural University, Peshawar.
Prasad, S. and Tomer, O.S. 1996. Effect of body condition at calving and post partum level of feeding on milk production and composition, of crossbred dairy cows. Indian J. Dairy Sci., 50 : 413.
Prasad, S., Singh, R.K. and Bisht, G.S. 1999. Measure of Persistency and its relationship with Peak yield and lactation milk yield. Indian J. Dairy Sci., 52 (5): 308-14.
Pryce, J.E., Coffey, M.P. and Brotherstone, S. 2000. The genetic relationship between calving interval, body condition score and linear type and management traits in registered Holsteins. J. Dairy Sci, 83 : 2664-2667.
Roche, J.R., Lee, J.M., Macdonald, K.A. and Berry, D.P. 2007. Relationships among body condition score, body weight and milk production variables in pasture-based dairy cows. J. Dairy Sci., 90 : 3802-3815.
Roche, J.R., Friggens, N.C., Stockdale, C.R., Baumgard, L.H., VanBaale, M.H. and Berry, D.P. 2009. Body condition score and its association with dairy cow productivity, health, and welfare. J. Dairy Sci., 92 (12): 5769-5801.
Singh, V., Singh, V.K., Singh, S.P. and Sahoo, B. 2015. The effect of body score condition at calving on milk yield, milk composition and udder health status of dairy animals. J. dairy Vet. Anim. Res., 2 (2): 22.
Takeshi, Y., Takeda, H., Nishirua, A., Sasai, Y., Sugawara, N. and Tagoshi, K. 2011. Phenotypic relationship between lactation persistency and change in body score condition in first -lactation Holstein cows. J. Anim. Sci., 24(5): 610-613.
Thomas, C.K. and Sastry, N.S.R. 2012. Dairy Bovine Production, 2nd revised Edn., Kalyani Publishers, New Delhi, India.